So why should do-nothing investors (like us) invest in low-cost index funds? The answer: it’s probably one of the best investing advice given by one of the greatest investors of our time — Warren Buffett. Without further ado, here are the 3 key reasons why you should invest in an index fund, especially if you are new to investing:
- Priceless Advice from the Oracle of Omaha
- Index Funds: Your Best Chance for Success
- Easiest Investing Strategy to Follow: Do Nothing
1. Priceless Advice from the Oracle of Omaha
The term “do-nothing investor” was mentioned in Warren Buffett’s 2016 annual letter to his Berkshire Hathaway shareholders.
In case you are new to world of investing and have yet to hear of Warren Buffett, he is the Chair and CEO of Berkshire Hathaway. Buffett lives and works in Omaha, Nebraska and is known as the Oracle of Omaha. A legendary value investor, he made his fortune of over $100 billion by investing mainly in American businesses and public companies such as Coca-cola, Gillette and American Express. If you would like to find out more about Buffett1, I’ve place the link at the end of the article.
Regardless of whether you are a shareholder of Berkshire Hathaway or not, if you have yet to read any of Buffett’s annual letters, you have to put it on your must-read list now. He not only shares about the business and investment aspects of Berkshire Hathaway, his letters are also filled with personal recounts and anecdotes; mistakes he has made and lessons he has learnt (rarely will you find a CEO admitting to making even a single mistake and owning it).
Back to Buffett’s 2016 letter. Here he writes about Long Bets, a nonprofit foundation’s website (the benefactor of Long Bets is Jeff Bezos) where bets on predictions of the future are made. How it works is simple: You have the Predictor who wages a bet that a specific event will take place by a certain time in the future. You then have the Challenger who takes on the other side of the bet. The stakes of the bet are donated to the winner’s charity of choice. Long Bet is quite ingenious I must say. Here’s a screenshot of the Long Bet that Warren Buffett placed:
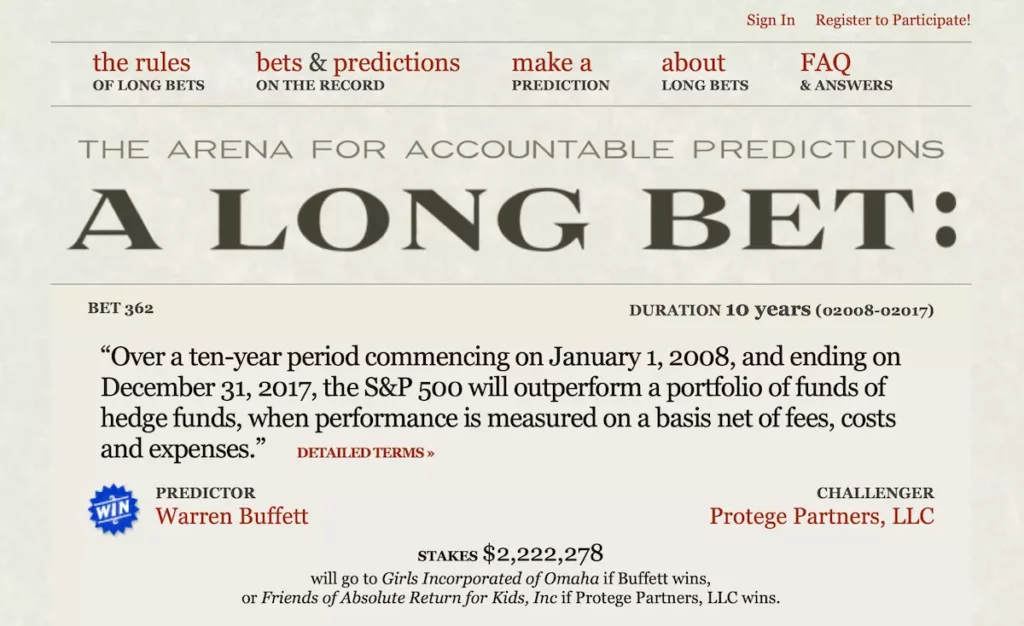
Buffett wrote that when he first posted his bet, it was complete silence. Nothing but the sound of crickets. What had happened to all the Wall Street titans? Shouldn’t they be queueing up for a sure win? All they had to do was to beat the Average Joe return of the S&P (Standard & Poor’s) 500 index.
Alas, a challenger emerged. Ted Seides from Protege Partners was ready to back up his words with action and defend his profession. The bet was on. 10 years later, the Girls Incorporated of Omaha probably fell off their chairs when they received a cheque for over $2 million.
You can read the full details of “The Bet” recounted by Buffett in his 2016 annual letter2. I’ve place the link at the end of the article. Go to Page 21, under the heading: “The Bet” (or how your money finds its way to Wall Street).
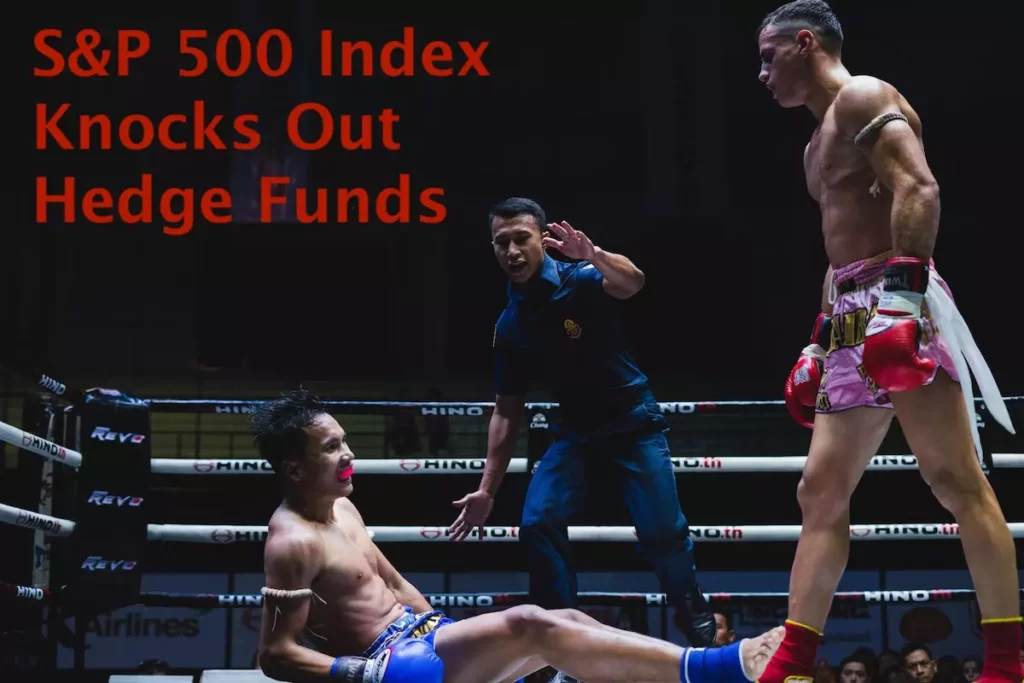
The S&P 500 index had beaten the basket of five hand-picked hedge funds hands down. Hurray for the Average Joe! In his letter, Buffett goes on to compare Group A (active investors) vs Group B (do-nothing investors) and made the following points:
- Finding an active fund manager who can consistently outperform the stock market over long periods of time is a daunting task. The reality is that the vast majority of fund managers will likely fail.
- And even if you are able to find that rare gem of a manager, chances are your return on investment will be eroded by self-serving policies and exorbitant fees. In Buffett’s words, “When trillions of dollars are managed by Wall Streeters charging high fees, it will usually be the managers who reap outsized profits, not the clients.”
So what was Buffett’s advice at the end of the day? Rather than invest in an actively managed fund, your best bet would be to invest in a low-cost passive S&P 500 index fund.
Rather than invest in an actively managed fund, your best bet would be to invest in a low-cost passive S&P 500 index fund.
2. Index Funds: Your Best Chance for Success
Hopefully, I’ve piqued your interest in index funds. But before I dive deeper, for those uninitiated, it’s time I briefly answer the question: what on earth in an index fund?
Simply put, in the world of finance and economics, an index is a numerical indicator or measurement of a group of things.
For example, a hot topic these days is inflation — soaring egg prices, elevated energy costs, sky-high rents, etc. To measure the impact of inflation, economist pick a basket of everyday items that you and I have to pay for, ranging from basic food items to transport to housing.
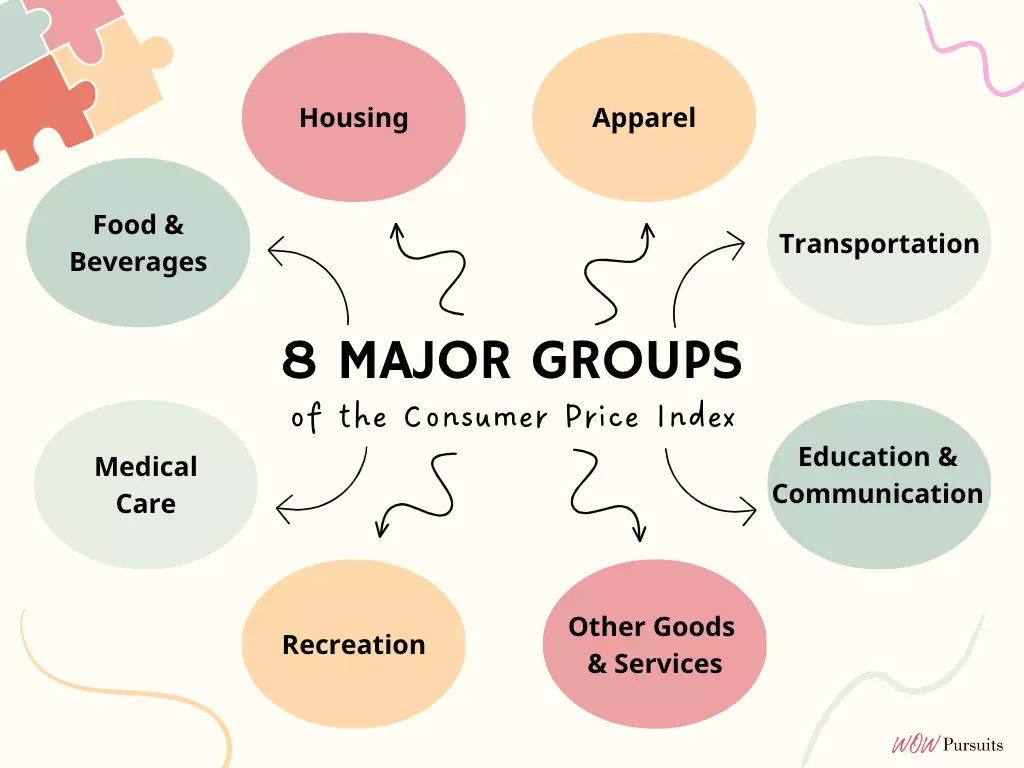
The prices of all the selected items are weighted, aggregated and divided (just think of it as a “magic brew” of prices) to give us the measurement of how fast or slow prices of everyday items are going up or down every month. This economic indicator is called the Consumer Price Index (or CPI).
Likewise, for the stock market, the S&P 500 index represents the collective prices of a basket of stocks. In this case, the largest 500 publicly listed companies in the US spread across 11 sectors. Companies in the S&P 500 include Alphabet (Google), Tesla, Morgan Stanley, 3M, Johnson & Johnson, Kellogg’s, Pfizer and of course, Berkshire Hathaway.
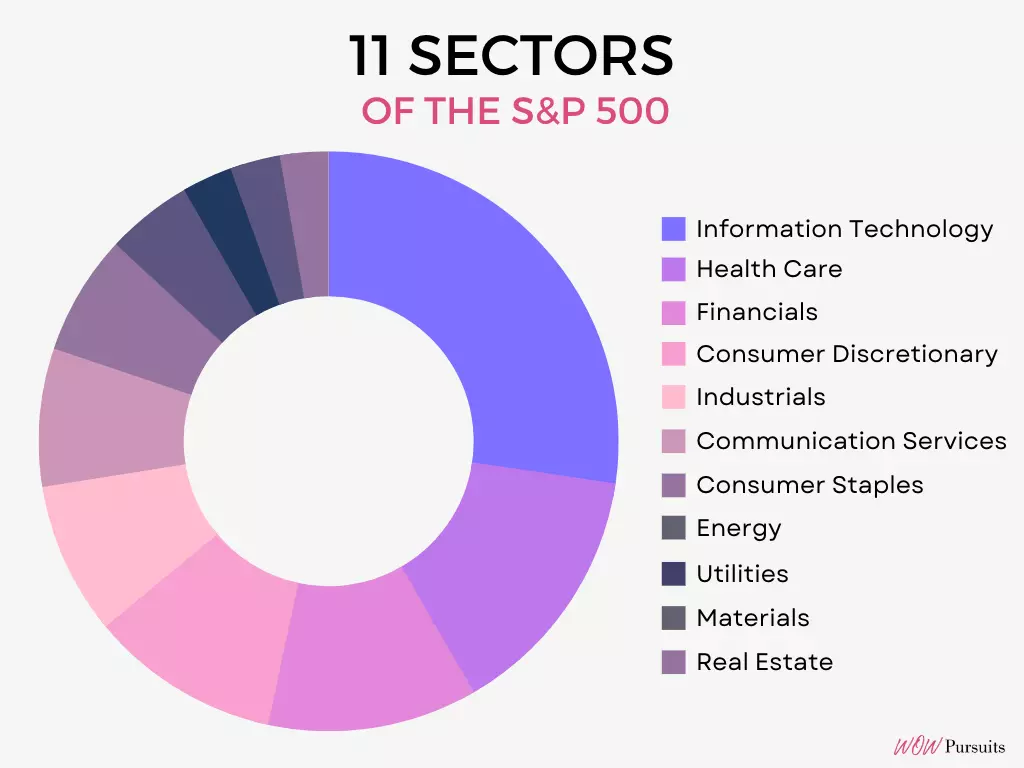
In other words, the S&P 500 index acts as an indicator of the performance for the US stock market. It is of course just one of many indicators. Other popular US stock market indexes include the Dow Jones Industrial Average and the Nasdaq Composite Index.
The S&P 500 index acts as an indicator of the performance for the US stock market.
If you are keen to learn more about the “magic sauce” behind how the S&P 500 index is calculated, I’ve placed the link to S&P Index Research Insights3 at the end of the article for your further indulgence.
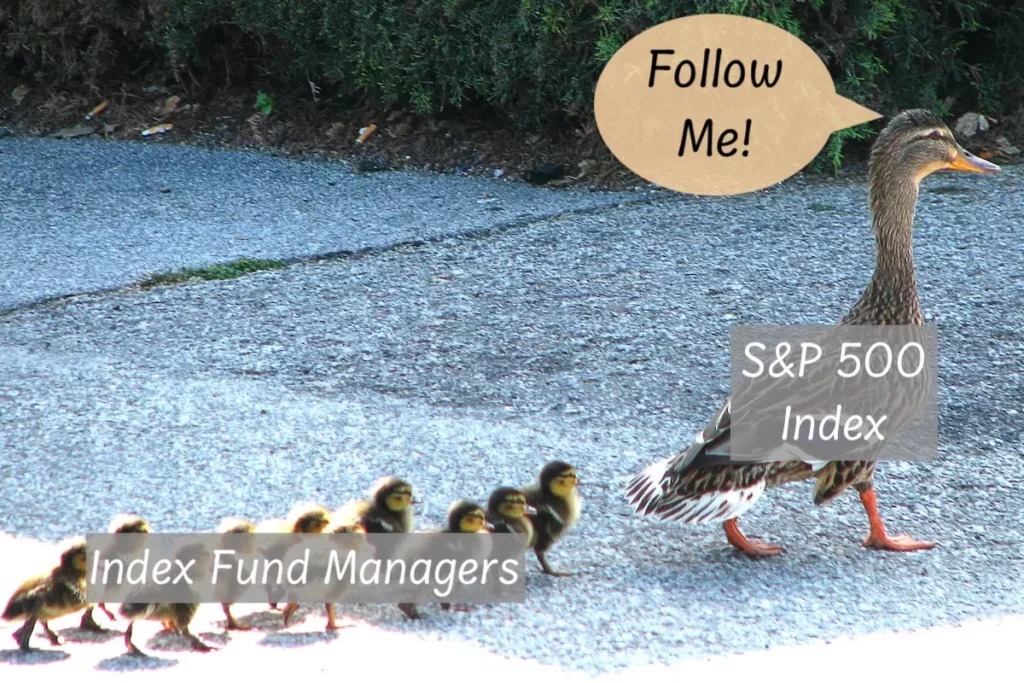
As investors, we can’t buy the S&P 500 index per se. After all, it’s just a number. So what happens is that a fund company (like Vanguard) sets up a fund (a pool of investors’ money) and goes about buying the exact composition of stocks that mimics the S&P 500 index.
Once all 500 company stocks are acquired, it is game on. After which, the main role of the index fund manager is to track the S&P 500 as close as possible. No special talent or stock picking prowess required. Just follow the index. Which is why index funds are often referred to as tracker or passive funds.
And because index funds don’t require any form of active management or trading, the fees usually represented by the expense ratio of passive index funds are extremely low compared to actively managed fund.
For instance, the average expense ratio of the Vanguard S&P 500 ETF (stock code: VOO) stands at 0.03%. According to Investopedia4, a reasonable expense ratio for an actively managed fund is about 0.5% to 0.75%. Anything greater than 1.5% is considered high these days.
Even if we take the low end of 0.5% (which is considered cheap for an actively managed fund), it is still about 16 times more than VOO.
Thus, investing in a low-cost index fund will ensure that you keep most of your profits over the long term (it all adds up over time), thereby improving your chance for success. You can at least be rest assured that your hard-earned savings isn’t being siphoned off by some underserving fund manager.
Investing in a low-cost index fund will ensure that you keep most of your profits over the long term.
No doubt that your bottom line is important. But how about your overall return on investment? No point if the returns are pittance. Well, let’s take a closer look at the historical annual returns of the S&P 500.
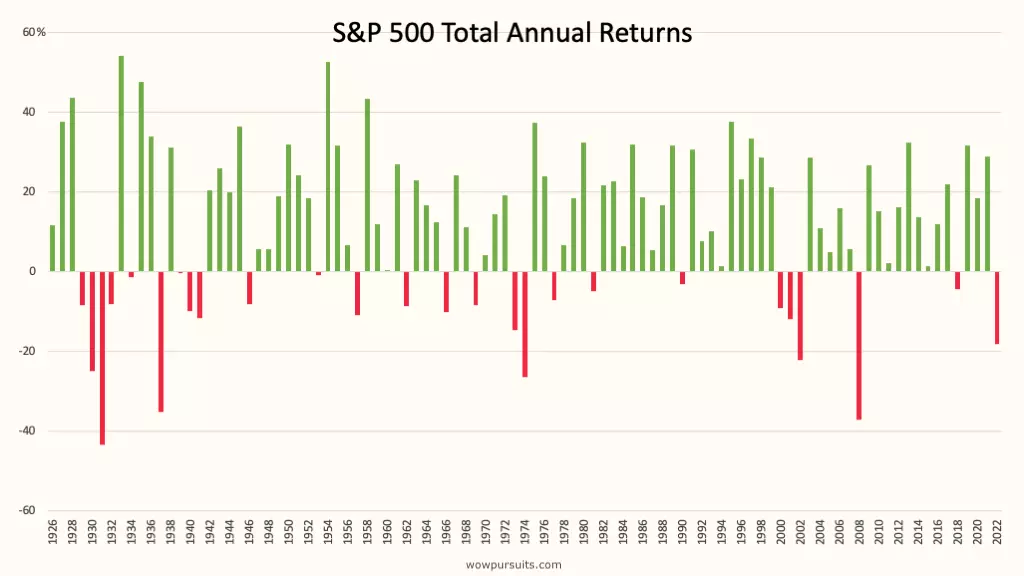
The above chart shows the total annual returns of the S&P 500 from 1926 to 2022. The S&P index started in 1926 with 90 companies and expanded to 500 companies in 1957 to what we know today as the S&P 500 index.
Here are the historical facts since the inception of the S&P 500 index:
- As expected, the S&P 500 doesn’t yield positive returns every year. Markets go up and down, experiencing booms and busts throughout history.
- However, over the last 65 years, the S&P 500 has demonstrated resilience and often makes a strong recovery in a relatively short period of time.
- Based on the data provided by Professor Aswath Damodaran from NYU Stern School of Business, the S&P 500 yielded negative total annual returns in 15 out of 65 years. In other words, the S&P 500 yielded positive total annual returns at about 77% of the time (on a year-to-year basis).
- The highest recorded positive total annual return was in 1958 (during the post-World War II economic expansion period) at 43.72%. The lowest recorded negative total annual return was in 2008 (during the Great Financial Crisis) at —36.55%.
Note: The annual return of the S&P 500 calculated above includes dividends (in addition to the price changes of the index) and is also known as the total annual return. Although some investors only consider price returns, it cannot be denied that dividends also contribute to the overall return on investment, hence, my preference for Professor Damodaran’s numbers.
So what is the average rate of return of the S&P 500 since its inception? Well if you had invested a lump sum of $10,000 at the beginning of 1957 and reinvested all dividends, you would have $5,840,666.40 at the end of 20225.
That works out to a non-inflation adjusted annualised rate of return (or Compound Annual Growth Rate, CAGR) of 10.13%. That means your investment would have increased by more than 580 times over a span of 65 years.
65 years is almost a lifetime. What if we are looking at a shorter time frame and a larger investment sum? Using the same S&P 500 historical data, if you had invested $100,000 in 1992 (30 years ago) and reinvested all dividends, you would have $1,731,822.52 by the end of 2022. Not too shabby for the average investor, don’t you think?
This buy and hold investment strategy is clearly NOT a get rich quick scheme — far from it. The idea behind it is pretty simple (perfect for the newbie investor). Buy a basket of the best American businesses (S&P 500) and just sit back and let time do its thing, i.e. let your returns naturally compound over time. It’s your best chance for success.
Check out: Understanding Index Funds: Does the Tortoise Really Win?
3. Easiest Investing Strategy to Follow: Do Nothing
Years ago when I first read about Warren Buffett’s advice to invest in a low-cost S&P 500 index fund, my first thought was: really? I mean, for someone who made his fortune from picking and investing in individual stocks/businesses, his advice for both retail and institutional investors was NOT to stock pick and just go with a low-cost index fund like the S&P 500. What’s up with that?
Buffett’s advice for both retail and institutional investors was NOT to stock pick and just go with a low-cost index fund like the S&P 500.
Then I read Buffett’s 2013 annual letter6 and realised why. Buffett is well known to walk the talk. In this letter he wrote about his will. One bequest specifies that cash be put into a trust for the benefit of his wife. His instructions to the trustee was to put 90% of the cash into a low-cost S&P 500 index fund (Vanguard was suggested by Buffett) and the remaining 10% into short-term government bonds.
Wow! 90% into the S&P 500! Isn’t that too risky? Those were my first thoughts. Maybe if I were in my 20s, a 90/10 portfolio would have made sense. But if I were in my sunset years, I doubt I’ll be comfortable with a 90/10 portfolio. I might get a heart attack whenever the market takes a nosedive.
Check out: Portfolio Rebalancing for Beginners
But then again… this is Warren Buffett we’re talking about. Even though ALL of his Berkshire shares will be distributed to various charitable organisations over 10 years after the closing of his estate, I’m sure his own personal holdings is no small sum.
In fact, I would wager that that the fixed income his wife will receive from the 10% bond allocation would be more than enough to comfortably cover her day-to-day expenses. To put it another way, regardless of how the stock market is doing, even on a 90/10 portfolio, Buffett’s wife will be able to sleep like a baby every night.
In my opinion, Buffett is convinced that the 90/10 portfolio will work like a charm for his wife who by the way has no or little interest in the stock market (Buffet mentioned about his wife’s disinterest on several occasions). Let me explain.
You see, for Buffett’s buy and hold investment strategy to work, it involves two parts: (1) buy and (2) hold. We know already what to buy. In this case, a low-cost S&P 500 index fund.
The next part is to HOLD. This means NOT selling when the market gets into a fit (which will certainly happen every now and then). The key is to literally do nothing when fear grips the stock market. And I believe Buffett is certain his wife will not flinch whenever this happens.
By the same token, this plan of action or rather inaction would best suit the vast majority of investors. Which is why Buffett is such an advocate of low-cost passive index funds and is putting his own money where his mouth is.
The worst thing an investor can ever do is to buy high and sell low. To avoid this folly, regardless of when you buy into the S&P 500, never sell into a correction. If you have nerves of steel, you should be buying and averaging down instead. Given enough time, the markets will eventually recover and continue its uptrend, as depicted by history.
Here’s the inflation-adjusted historical chart of the S&P 500 index since 1957:
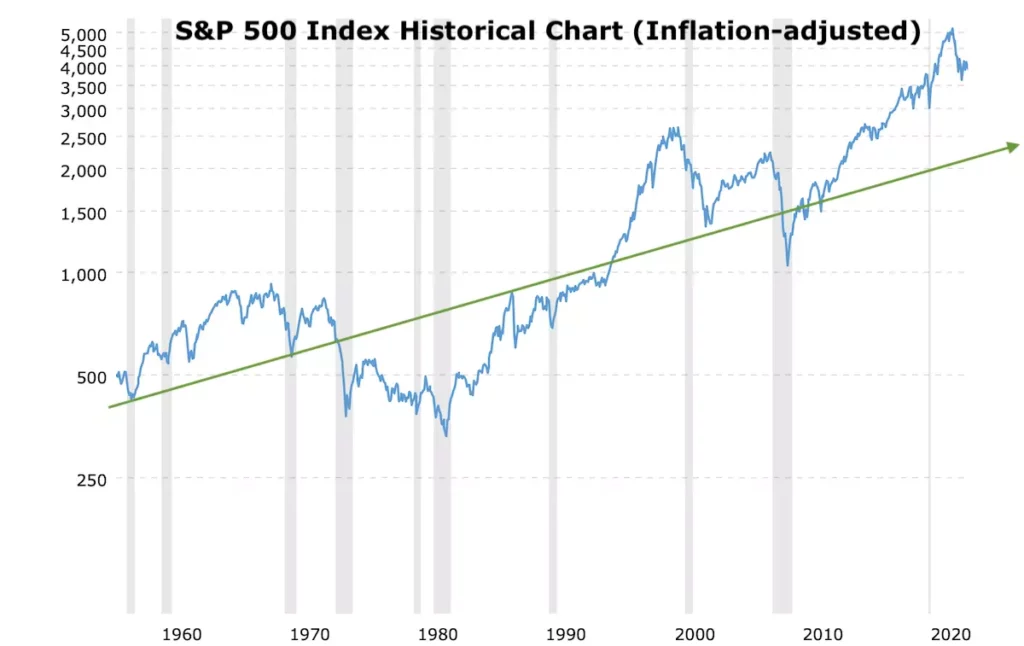
The chart tells a story of good and bad times. The grey-coloured columns represent periods of economic recession and fear (a total of 10 recessionary periods, lasting from a few months to a few years). Be it as it may, the long term uptrend of the S&P 500 has remained intact.
Check out: Investing During a Recession: What You Need to Know
But… here comes the but… past performance is no guarantee of future results. This is the undeniable truth and it should never be taken lightly. What if the S&P 500 crashes and never recovers in the future? What if World War III starts and all hell breaks loose? What if Warren Buffett is wrong?
What is for certain is that the future is full of uncertainty.
So does that mean we shouldn’t invest? Honestly, that’s not for me to say, but for you to decide. Nobody has a crystal ball. Not Warren Buffett, most definitely not me or anyone else.
In hindsight, ask yourself this: after two world wars, the Great Depression, multiple global recessions, the Great Financial Crisis and the recent COVID-19 pandemic, is the S&P 500 index still alive and kicking?
Looking ahead, regardless of what is going on in the world, would you still be drinking Coca-cola? Would you still be eating MacDonald’s or using a Gillette shaver? Will the Internet still be around? You decide.
I hope this article has opened your eyes to index funds and why they are so popular amongst retail investors, especially within the FIRE community. Of course this is just the start.
Check out: How We Achieved Financial Independence Retire Early in 7 Years
Before you jump on the index fund bandwagon, it’s probably worthwhile to find out more about what other index funds are out there besides the S&P 500, how they work and the risks associated with them. I’ll address them down the road, so do stick around.
Do you own any index funds? Do share with us in the comment section below.
Sources:
- The Oracle of Omaha: https://www.investopedia.com/terms/o/oracleofomaha.asp
- Berkshire Hathaway Shareholders Annual Letter 2016: https://www.berkshirehathaway.com/letters/2016ltr.pdf
- Methodology Matters S&P Dow Jones Indices: https://www.spglobal.com/spdji/en/research-insights/index-literacy/methodology-matters/
- What is a Good Expense Ratio for Index Funds?: https://www.investopedia.com/ask/answers/032715/when-expense-ratio-considered-high-and-when-it-considered-low.asp
- S&P 500 Returns since 1957: https://www.officialdata.org/us/stocks/s-p-500/1957?amount=10000&endYear=2022
- Berkshire Hathaway Shareholders Annual Letter 2013: https://www.berkshirehathaway.com/letters/2013ltr.pdf
You may also like: Beyond Borders: Why Invest in a Global Index Fund | Why We Love Dividend Investing but It’s Not for Everyone | Dividend Investing Ideas: The Dogs of the Dow Strategy | How REITs Work: Get Started on Real Estate Investing
