
If you have been shopping around for a retail REIT to invest in (no pun intended) or perhaps would like to gain further insight into what lies behind the key performance numbers of retail REITs, then this article is for you.
As a retail REIT investor or potential investor, the essential questions you need to ask are: how can I tell if a retail REIT has been performing well and will it continue to do so down the road?
This article is NOT an evaluation of which retail REIT is the best. That decision should be yours to make. Instead, it is about learning what numbers to look out for and what they mean for you as an investor.
Ultimately, it’s about equipping you with more knowledge so that you can make a better informed decision before investing your hard earned money. Here’s what I’ll be covering:
Full disclosure: At the time of writing, Mrs Wow and I are unit holders of Fraser Centrepoint Trust or FCT (stock code: J69U) and CapitaLand Integrated Commercial Trust or CICT (stock code: C38U). Other than owning shares in both S-REITs, we do not have any affiliation with FCT or CICT. This article is written solely based on our own opinions and experience. It is for educational purposes only and is NOT investment advice.
In this article, I’ll base my case study on FCT simply because they are the largest (by market capitalisation, as of March 2023) pure-play retail REIT in Singapore and being an existing unit holder of FCT, I personally keep close tabs on them.
At the end of the day, it doesn’t matter which retail REIT is used as a case study for this article. What’s important to learn are the principles of analysis that can be applied to any retail REIT, regardless of geographical location. Let’s begin.
1. Income Performance
First, we have income performance. Like any business, it boils down to consistent or better yet, growing income and profitability year after year.
Let’s start by looking at the first three lines of FCT’s statement of total return1, (1) Gross revenue, (2) Property expenses and (3) Net property income:
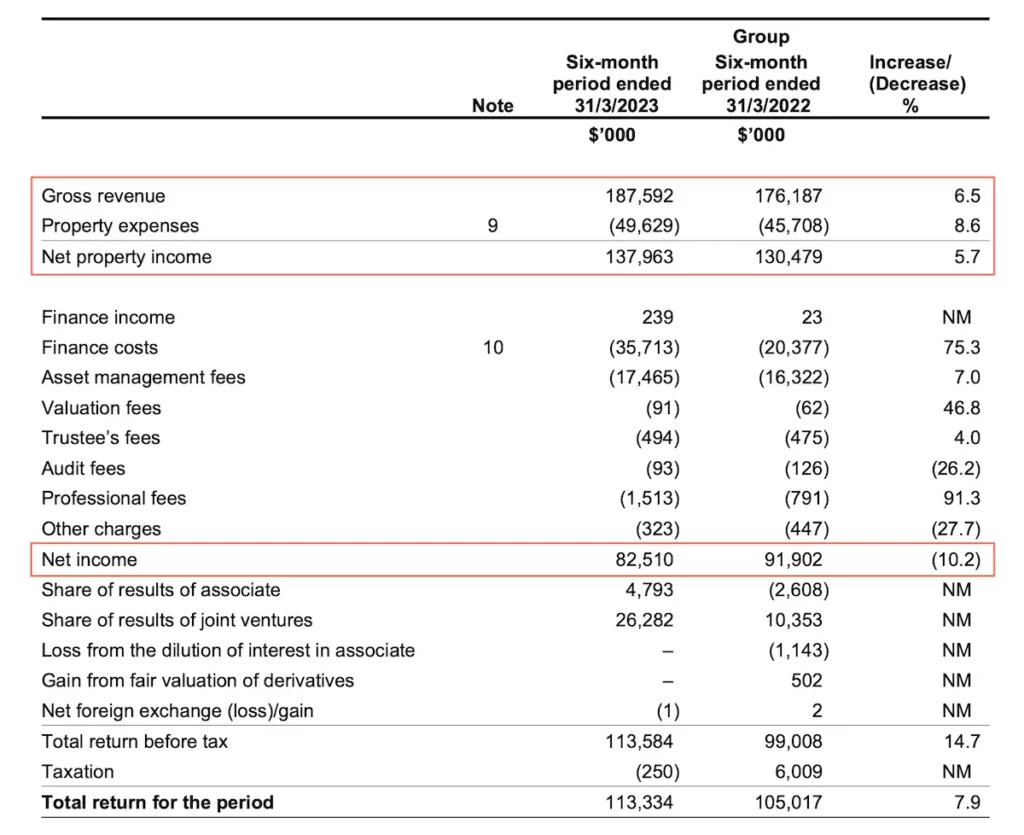
Gross Revenue
First, there is gross revenue which includes all sources of income generated from operating the shopping malls. Besides the rental income (including percentage gross turn over or GTO) from shop units, income may also generated from other sources:
- Atrium space: Income is generated from holding events (e.g. during festive seasons) within the atrium of the shopping mall.
- Car park space: Income is generated from seasonal and hourly parking at the shopping mall.
- Advertising and promotional space: Income is generated by renting out advertising and promotional spaces within shopping malls to third-party advertisers or retailers.
- Signage space: Income may also be generated by leasing signage space within the shopping malls to tenants.
- ATM and vending machine space: Income may also be generated by leasing out space for ATMs and vending machines within the premises of the shopping malls.
Property Expenses
Next, we have property expenses (or operating expenses) which include any expense tied to the operations of the shopping mall such as property tax, maintenance, utilities, property management fees, security, marketing and IT.
Net Property Income
Then, we have Net Property Income or NPI which is the gross revenue minus the property expenses. NPI is often used as the main barometer to measure how well a REIT’s portfolio of properties is performing. In other words, NPI is akin to the operating profit of a REIT and excludes deductions from borrowing costs, asset management fees, etc.
Note: Do not confuse NPI with net income which takes into consideration non-operational income, expenses and related fees. As seen in the financial statement above, net income is on a separate row below NPI.
For NPI to be a more meaningful, you’ll need to compare it year-on-year or better yet, over a few years in tandem with other financial indicators. For example, here is the five-year financial summary for FCT2:
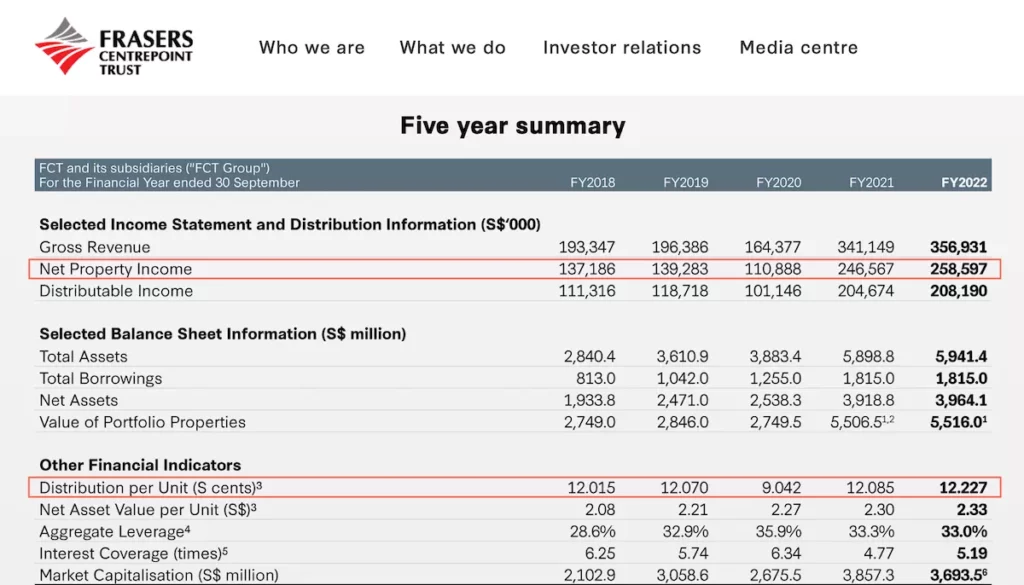
As seen, NPI has been increasing over the last five years, except for FY2020, when the COVID-19 pandemic hit shopping malls hard. Even then, FCT’s NPI didn’t tank too badly (relatively speaking) with a 20% decline from the year before. This, of course, resulted in a drop in distribution per unit (DPU) in FY2020.
Also, a higher NPI doesn’t necessarily mean better performance per se. In FCT’s case, NPI came roaring back in FY2021, mainly due to the addition of new properties to FCT’s portfolio. The acquisitions proved accretive and resulted in a higher DPU in FY2021 and FY2022 despite the headwinds from COVID-19.
NPI is akin to the operating profit of a REIT and excludes deductions from borrowing costs, asset management fees, etc.
The main takeaway is that NPI is but one single financial indicator. Although it’s undeniably a key performance indicator, it should always be viewed holistically.
2. Operational Performance
The next set of performance indicators reflects the operational prowess of a retail REIT and provides some guidance on the near term outlook.
Occupancy Rate
Perhaps one of the most used indicators of performance for any REIT (regardless of sector) is occupancy.
Of course, nothing beats 100% consistent occupancy for any property asset. However, in reality we all know this is not easy to achieve. Tenants come and go. Some stay for the long haul, while some leave prematurely. To be fair, there are times when it’s beyond the control of the landlord.
Nonetheless, if demand outweighs the supply of prime locations, you can be sure that occupancy will be close to full for shopping malls that are well located and bustling with activity.
To get an idea of actual occupancy rates for suburban prime shopping malls let’s take a look at FCT’s portfolio occupancy3:
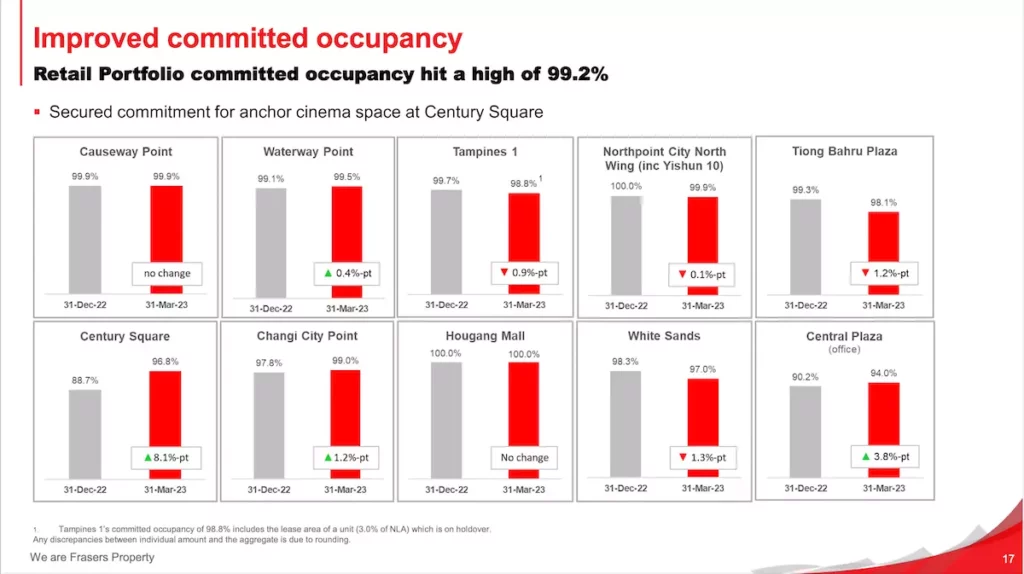
As seen, the overall committed occupancy for the entire portfolio is more than 99%. Impressive! Excluding Central Plaza which is a mixed development with a 20-storey office building (the only mixed development in FCT’s portfolio at the moment), the occupancy rate for FCT’s shopping malls range from 96.8% to 100%.
Occupancy rates will naturally fluctuate over time. In FCT’s case, under normal circumstances, occupancy rates tend to hover in the high 90s. Anything below 90% would probably raise some eyebrows.
Case in point, in the previous quarter, the committed occupancy of Century Square dropped to 88.7% but has quickly recovered back to 96.8% with the onboarding of a new cinema operator (Cathay Cineplexes) scheduled to open later in the the year.
In essence, it’s not uncommon for well located, well managed shopping malls to maintain occupancy rates close to 100%. In fact, when times are good, there’s likely a waiting list of tenants eager to snap up any available units within a thriving shopping mall.
Tenant and Trade Mix
Besides a healthy occupancy rate, the quality and mix of tenants are perhaps the most critical factors that affect the overall performance of a shopping mall.
In order to continuously attract shoppers, the REIT manager has to curate popular brands that appeal to the local demographic, brands that are shopping magnets.
This means the shopping mall has to periodically refresh its retail offerings not just with the latest and trendiest brands, but also create a complementary environment for this.
An AEI (Asset Enhancement Initiative — means a portfolio property will be renovated and reconfigured with the intention to increase its value and profitability) coupled with refreshed brands, could potentially transform a dreary shopping mall into the coolest kid on the block.
AEIs are also a good sign that the REIT manager is hard at work improving the returns on its assets. Not surprisingly, at the time of writing, FCT has announced that AEI works for Tampines 1 mall (opened on April 2009) has been scheduled to commence in 2Q 2023. Here’s the update from FCT:
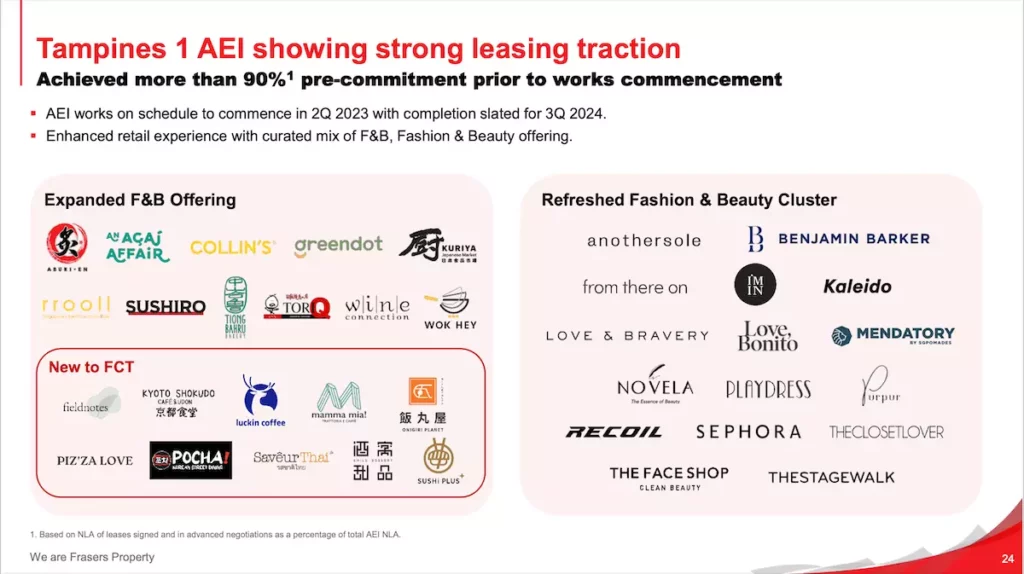
Frankly, I’m not much of a fashionista, but the refreshed and expanded F&B offerings look yummy. Can’t wait!
An AEI coupled with refreshed brands, could potentially transform a dreary shopping mall into the coolest kid on the block.
On top of getting that killer tenant mix that breeds vibrancy into a shopping mall, trade mix cannot be ignored — essential services should form a significant portion of a retail REIT’s portfolio.
Essential services are categorised as services we cannot do without to meet our basic needs. They include F&B outlets, supermarkets, pharmacies, medical & dental clinics, hair salons, etc. Think about it. Only essential services were allowed to continue operations throughout the COVID-19 pandemic with minimal disruption.
Having a trade mix focused on essential services is definitely a plus and provides resilience and stability to a retail REIT’s assets. Here’s a look at FCT’s current trade mix:
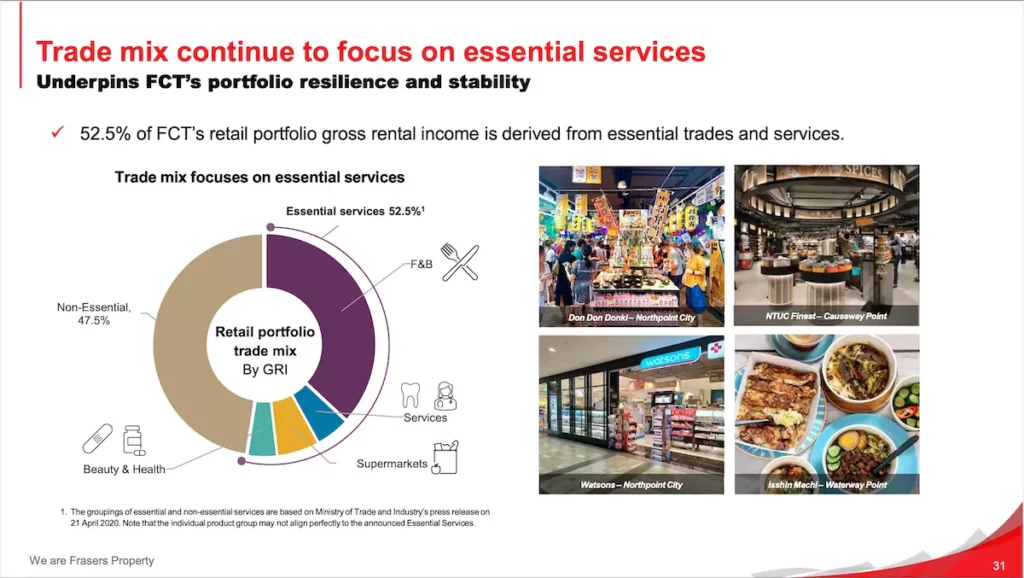
Having a portfolio with more than 50% of the gross rental income (GRI) from essential services is definitely going to help a unit holder like me sleep better at night.
Having a trade mix focused on essential services is definitely a plus and provides resilience and stability to a retail REIT’s assets.
The bottom line is, essential services do provide a very solid base to the trade mix of any retail REIT. It’s definitely something that shouldn’t be overlooked.
Rental Reversion
Another key indicator of operational performance I would like to touch on is rental reversion. Rental reversion is simply the percentage difference between the expired and renewed rental rate.
You get a positive rental reversion when a tenant renews the lease at a higher rental rate. The converse will result in a negative reversion. Positive rental reversion is a good sign of healthy leasing activities and potential income growth.
Many factors influence rental reversion, such as a shopping mall’s location, the retail market environment and the timing of when the leases are due for renewal.
For instance, FCT saw a 50% to 60% drop in its portfolio shopper traffic due to COVID-19 restrictions. Retail activity at its shopping malls were inevitably affected.
Despite the poor retail market conditions, FCT held up pretty well during this period of time. For FY2021, although one of its shopping malls, Changi City Point saw a negative rental reversion of 9.8%, its overall portfolio rental reversion ended up flat4.
In a way, rental reversion represents the “pricing power” of a property asset. In inflationary times, so long as demand for quality retail space remains healthy, tenants will likely renew their leases at higher rental rates without protest. Here is the latest rental reversion numbers from FCT:
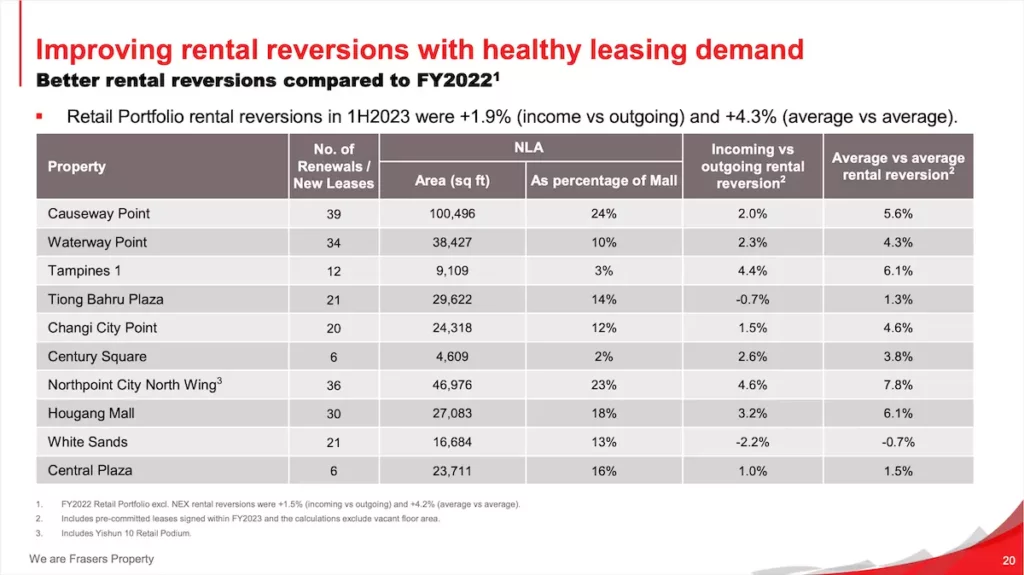
Looking at the rental reversion numbers above, you would notice the variation from shopping mall to shopping mall (not all shopping malls are created equal). Overall, FCT posted a retail portfolio rental reversion of +1.9% for 1H2023. It’s definitely an improvement since 2021. The question is: will rental reversions continue to improve?
Note: Although it is not mandatory for REITs to report their rental reversion results, they do so voluntarily (transparency and credibility go hand-in-hand). The thing is, the way a REIT calculates rental reversion is not standardised. As a general rule of thumb, pay more attention to the “incoming vs outgoing” rental reversion numbers. Also, make sure to read the fine print (usually in the footnotes) for details on what has been included and excluded in the calculations.
Weighted Average Lease Expiry
Another popular performance metric used by investors is the Weighted Average Lease Expiry or WALE. The simplistic way of calculating WALE is to take the total length of all leases in the portfolio and divide it by the total number of leases. This calculation of course assumes all leases are based on a uniform floor area and gives the average lease time per tenant.
In reality, every lease agreement varies in floor area and rental amount. Hence, a weighting component needs to be incorporated to account for this. The weighting component is essentially based on either the Net Leasable Area (NLA) or GRI. The higher the NLA or GRI of each lease, the higher its weighting. Here’s a snapshot of FCT’s WALE:
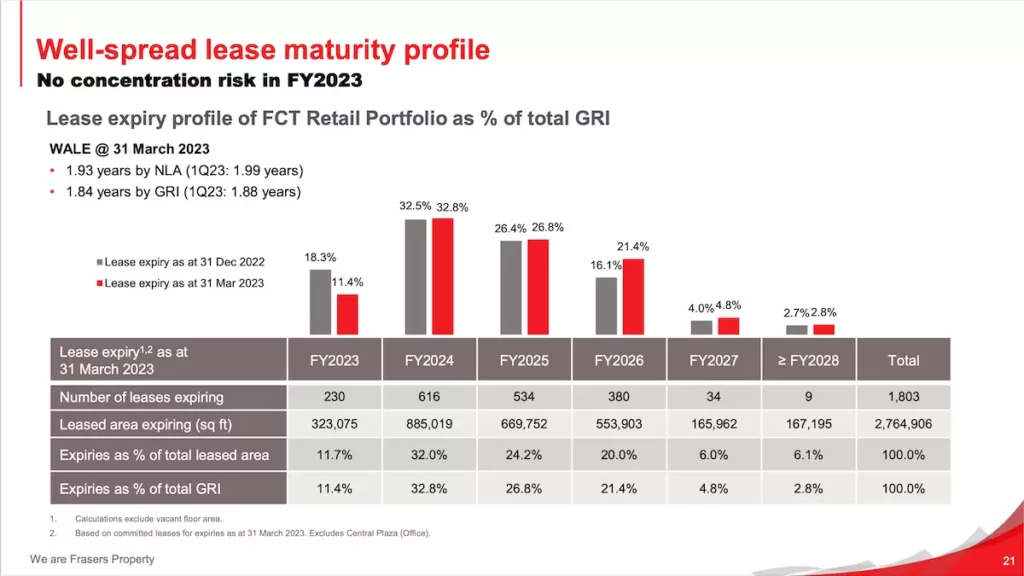
As seen above, FCT’s WALE by NLA is close to 2 years. That’s definitely within the ballpark for a retail REIT. Broadly speaking, the larger the property the longer the lease. Which is why industrial/logistic REITs (factories, warehouses, etc.) tend to have a longer WALE of 3 to 5 years. Data centre REITs are known to have an even longer WALE of 7 years or more.
So is a shorter WALE a handicap? Well, most investors tend to look favourably on REITs with a longer WALE as it represents stability (lower risk of vacancies and loss of income). However, a shorter WALE doesn’t necessarily spell “rocky boat” either.
At the end of the day, whether the WALE is 2 years, 5 years or even 7 years, so long as every lease gets renewed without disruption and the income stream of the REIT remains stable, everyone is happy.
What would probably be more meaningful to look out for is the lease expiry spread. Ideally, lease maturities should be evenly distributed throughout the years, with little to no concentration in a particular year.
In FCT’s case, FY2023 looks fine. However, FY2024 is a little on the high side with more than 30% of their leases expiring. Hopefully, it’ll not be too much for FCT to handle.
Ideally, lease maturities should be evenly distributed throughout the years, with little to no concentration in a particular year.
3. Financial Prudence
Last but not least, we need to look at the finances of a REIT, specifically its debt numbers. No matter how fantastic the performance numbers may look, if debt and risk are poorly managed, the entire REIT could come crashing down like a house of cards. The financial prudence of any REIT should never be taken for granted.
One of the key ratios used to assess the debt level of a REIT is its gearing ratio. I wrote extensively about the gearing ratio of REITs in a previous article and won’t expand on it here. Instead, let’s look at the latest financial highlights for FCT and see what we can learn from it.
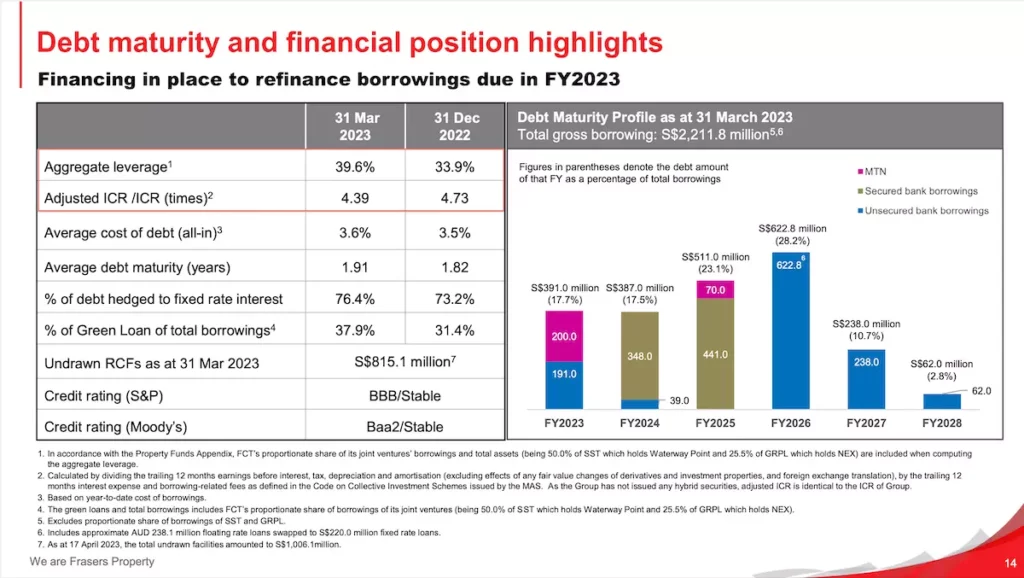
FCT’s gearing ratio (or aggregate leverage) has gone up to almost 40% (due to funding requirements for recent joint ventures). It still has some headroom from the 50% cap and should be fine so long as it doesn’t continue to creep up. I believe investors will be watching this number closely down the road.
Another number that is often used to determine if a REIT is able to handle its debt obligations is the Interest Coverage Ratio or ICR. The ICR is simply the REIT’s EBITA (earnings before interest, taxes and amortisation) divided by its borrowing expenses and related fees.
Note: For Singapore REITs (S-REITs), the ICR calculation is more stringent compared to other countries. It’s not just EBITA, but EBITA less the net fair value gains of properties, derivatives and foreign exchange translation. In other words, the ICR for S-REITs has inherently built-in buffer to ensure S-REITs have the ability to confidently absorb any financial shocks, should they occur.
The Monetary Authority of Singapore (MAS) stipulates a minimum ICR of 2.5 times for S-REITs. By and large, the ICR for any REIT should be well above 3 times to be considered prudent. In FCT’s case, it’s current ICR is more than 4 times and looks to be on top of its debt obligations.
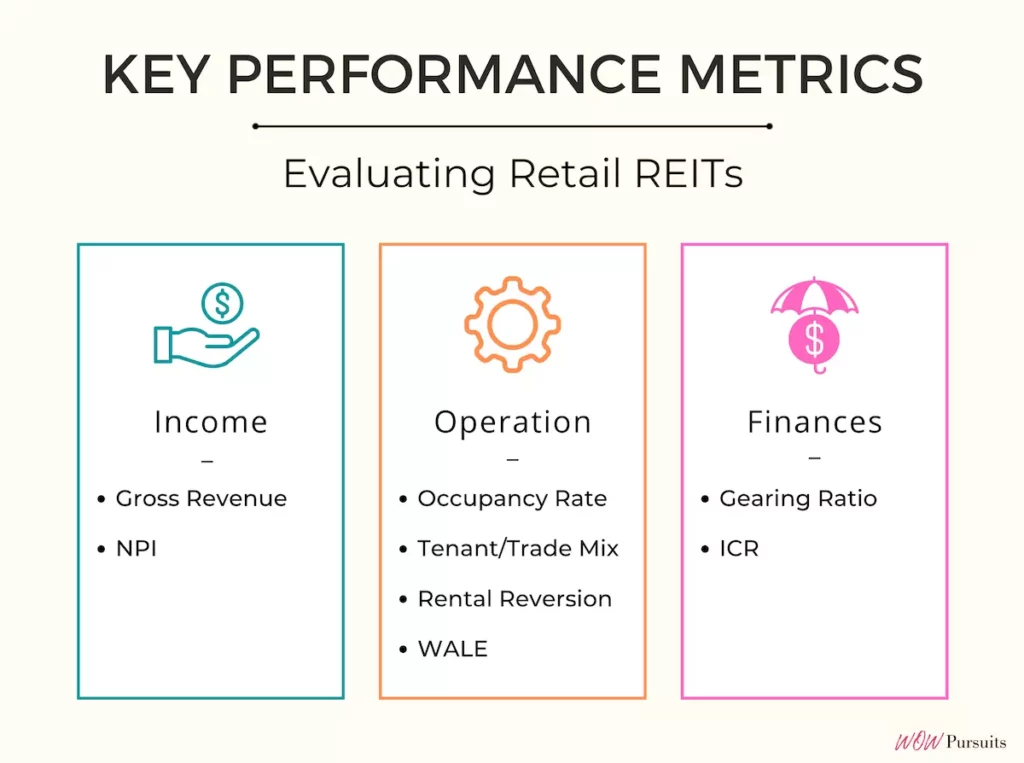
To recap, here is a diagram of the key numbers you need to know when evaluating the performance of a retail REIT:
I hope this article has deepened your understanding of retail REITs. In any case, should you have further queries/clarifications pertaining to this article, do leave your comment below. I would love to hear from you.
In the meantime, I wish you the very best on your REIT investment journey!
Sources:
- Fraser Centrepoint Trust Condensed Interim Financial Statements for the 6-month Period Ended 31st March 2023: https://fct.frasersproperty.com/newsroom/20230426_073720_J69U_TACEWQQQTQJUGO55.1.pdf
- Fraser Centrepoint Trust Financial Information: https://fct.frasersproperty.com/financial_information.html
- Fraser Centrepoint Trust Results Presentation for 1H2023: https://fct.frasersproperty.com/newsroom/20230426_073720_J69U_TACEWQQQTQJUGO55.3.pdf
- Fraser Centrepoint Trust Results Presentation for 2H2021: https://fct.frasersproperty.com/newsroom/20211027_072848_J69U_MTBXY4Q98RIXTJLM.3.pdf
More like this: Understanding Retail REITs in Singapore: A Beginner’s Guide | How REITs Work: Get Started on Real Estate Investing | What Types of REITs are Available: A Beginner’s Guide